Why Area on a Velocity-Time Graph Is Distance
Root Concept
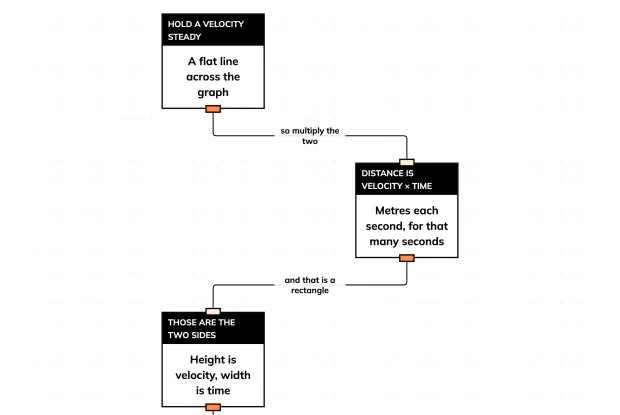
A velocity-time graph plots velocity against time, so its gradient is acceleration and the area between the line and the time axis is distance travelled — because distance is velocity multiplied by time, and multiplying the height of the graph by its width is exactly what finding an area does.
CodePLU Goal
Upgrading Human Mental Models
Learn how to think in Workflows

Concept Development By codeplu.com
The third step is where it stops being a rule to remember. Velocity and time are the two sides of a rectangle, so multiplying them and finding its area are the same act.
The Same Picture, A Different Meaning
Swap the vertical axis from distance to velocity and the graph looks much the same — lines rising, falling and running flat — while everything it says has changed. On a distance-time graph a horizontal line meant stopped. Here it means the opposite of stopped: a steady velocity, cruising along without speeding up or slowing down. The same shape, a completely different claim.
The steepness has changed meaning too. It used to be speed. Now it is how fast the velocity itself is changing, which is acceleration — so a steep line is hard braking or hard acceleration, and a flat line is no acceleration at all.
And a new reading appears that the distance-time graph never had. The **area** between the line and the horizontal axis means something: it is the distance travelled. That is a strange thing to be told, because the space under a line looks like empty page rather than a measurement, and nothing about it suggests metres.
It is worth knowing why it is true rather than accepting it, because the reason is short and it makes the rule impossible to forget or to misapply. Everything follows from one fact you have used since the first tutorial of this track: distance equals velocity multiplied by time.
Where the Area Rule Comes From
Why does multiplying give an area at all?
Because the two things being multiplied are the two sides of a rectangle. Take something moving at a steady 5 metres per second for 4 seconds. Distance is velocity times time, so it covers 20 metres. Now look at what that picture is on the graph: the line sits at a height of 5 and runs across a width of 4, and the space beneath it is a rectangle 5 tall and 4 wide. Its area is 20. **The multiplication and the area are not similar, they are the same calculation**, and the rectangle is just where it happens to be drawn. That is the whole derivation for constant velocity, and everything else is this one case repeated.
What if the velocity is not constant?
Then slice the time into pieces narrow enough that the velocity barely changes within each one. Over a hundredth of a second even a hard braking car has an almost constant velocity, so each thin strip is a rectangle and the rule applies to it. Add up every strip and you have the total distance — and adding up every strip under a line is what finding its area means. So the rule survives for any shape at all: a triangle when acceleration is steady, a curve when it is not. This is the same move mathematics makes everywhere, breaking an awkward thing into many easy ones, and it is why the area rule has no exceptions rather than a list of shapes it works for.
How do you find the area in practice?
By splitting the shape into rectangles and triangles, which covers almost every graph set as a question. A journey that accelerates from rest, holds a steady speed, then brakes to a stop draws a shape with a triangle at each end and a rectangle in the middle; work out the three areas and add them. For a curve, counting squares on the grid gives a good estimate, and squaring up the counting by including half-filled squares is accurate enough for any school purpose. Whichever method, the units come from the axes: a height in metres per second times a width in seconds gives metres, and the seconds cancel. Reading the answer off the axes like that is also the quickest check that the shape was split up correctly.
Is the area distance or displacement?
It follows the axis, exactly as it did on the previous graph. If the vertical axis is velocity, which carries a direction, then area below the axis counts as negative and the total is a displacement — so a journey out and back gives equal areas above and below that cancel to zero, which is the lap from the second tutorial appearing in a new form. If the axis is plain speed, everything is positive and the area is total distance travelled. The graph will not warn you which it is, so reading the axis label first is the habit that prevents the mistake. It is the same discipline the distance-time graph needed, and it catches the same class of error.
Real World Example
Three Shapes Worth Recognising
Each of these appears constantly, and in each the line and the area are answering two separate questions about the same motion.
Step 1
The triangle of a car pulling away
A car accelerating steadily from rest draws a straight line rising from zero, and the space beneath it is a triangle. Its area is half the base times the height, which says the distance covered is half what it would have been at the final speed throughout — which is right, because the car spent the whole time below that speed. The shape delivers an answer most people would otherwise guess wrongly. Averaging the start and end velocities gives exactly the same result, and the triangle is the reason that familiar shortcut works at all.
Step 2
Why stopping distances grow so fast
Braking from twice the speed draws a triangle twice as tall and, at the same braking rate, twice as wide, so its area is four times larger. Doubling the speed quadruples the distance needed to stop, and that is the geometry of the graph rather than a safety slogan. It is why the gap between 30 and 60 matters far more than the numbers suggest, and why braking distances in a highway code are not proportional to speed. A rule that looks like scaremongering turns out to be the area of a triangle, and the graph makes it obvious at a glance.
Step 3
A lift, read twice from one graph
A lift accelerates, cruises and decelerates, drawing a trapezium — two sloped ends and a flat middle. The line answers when the passengers felt heavy and light, since that is acceleration and so is read from the steepness of the sloped ends. The area answers which floor it reached, since that is distance, and the flat middle contributes the largest rectangle of it. Someone wanting to know about comfort reads the line, and someone wanting to know about arrival reads the space beneath it. The same graph is read two completely different ways depending on which question is being asked of it.
FAQs
Final Words
A velocity-time graph carries two readings at once, and neither is a rule that has to be taken on trust. The gradient is acceleration, because gradient is change per second and acceleration is change of velocity per second. The area is distance, because distance is velocity multiplied by time and multiplying the height of a graph by its width is what finding an area does.
A changing velocity does not break it. Slice the time finely enough and each strip is a rectangle, so adding the strips gives any shape at all — which is why the rule covers triangles and curves without exception.
That is motion described: speed, direction, change and two graphs to read them from. What this track never asked is what causes the change. The next track joins force, mass and acceleration into the single relationship the first tutorials pointed at and could not yet state.
Continue This Track
This concept is part 5 of Putting Numbers on Motion.
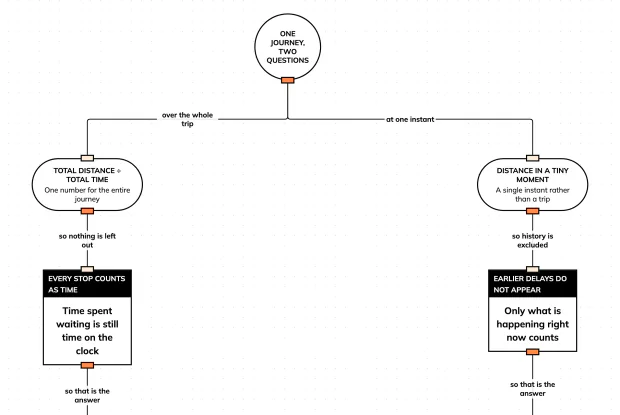
What Does Average Speed Hide? Two Kinds of Speed
A car averages 50 km/h and never once drives at 50. Find out why that is normal rather than contradictory, and sort the two kinds of speed in an interactive playground.
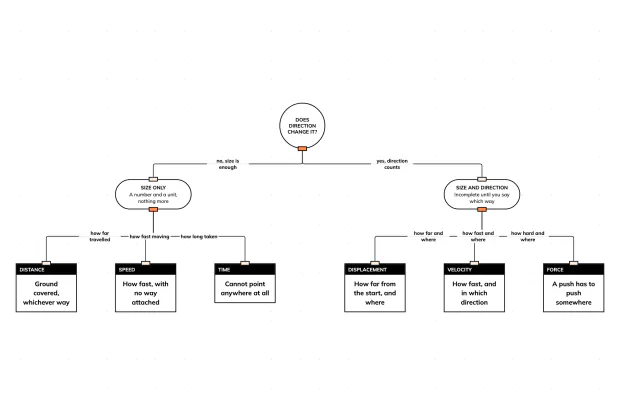
Why Direction Makes It Velocity, Not Just Speed
Run a full lap and your average velocity is zero, however hard you ran. Find out why direction changes the quantity itself, and sort six of them in an interactive playground.
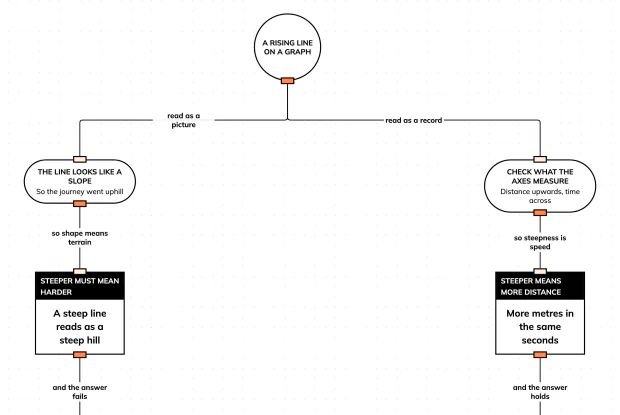
Why a Distance-Time Graph Is Not a Picture
A rising line does not mean a hill and a flat line does not mean level ground. Find out what a distance-time graph actually records, and read one properly in an interactive playground.
Why Slowing Down Is Also Acceleration
Braking is acceleration. So is turning a corner at a steady speed. Find out why acceleration means change rather than fastness, and build the three cases in an interactive playground.
Why Area on a Velocity-Time Graph Is Distance
On a velocity-time graph the steepness is acceleration and the area underneath is distance travelled. Follow why that is true rather than a rule to memorise, in an interactive playground.