Putting Numbers on Motion
Five parts on describing movement precisely, which the first physics track needed and did not have. It opens on a car that averages 50 km/h without ever driving at 50 — not a paradox but two honest answers, because average speed covers a whole journey including every stop while a speedometer covers a moment. The second part adds direction and finds that a full lap of a track leaves a real distance and a real speed beside an average velocity of exactly zero, which is what separates a vector from a scalar. The third takes on the mistake nearly everyone makes first: reading a distance-time graph as a picture of the route, so a rising line becomes a hill and a flat line becomes level ground, when flat actually means stopped. The fourth narrows a familiar word — braking is acceleration, cornering at a steady speed is acceleration, and a train at a constant 300 km/h has none at all. The last swaps the vertical axis to velocity, where the gradient gives acceleration and the space under the line gives distance, because velocity multiplied by time is what finding an area does.
CodePLU Goal
Upgrading Human Mental Models
Learn how to think in Workflows
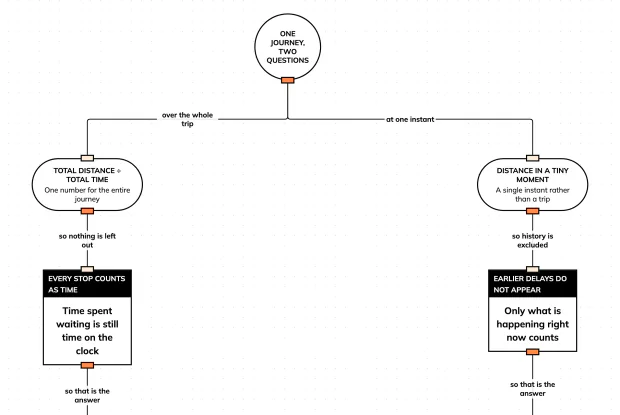
What Does Average Speed Hide? Two Kinds of Speed
A car averages 50 km/h and never once drives at 50. Find out why that is normal rather than contradictory, and sort the two kinds of speed in an interactive playground.
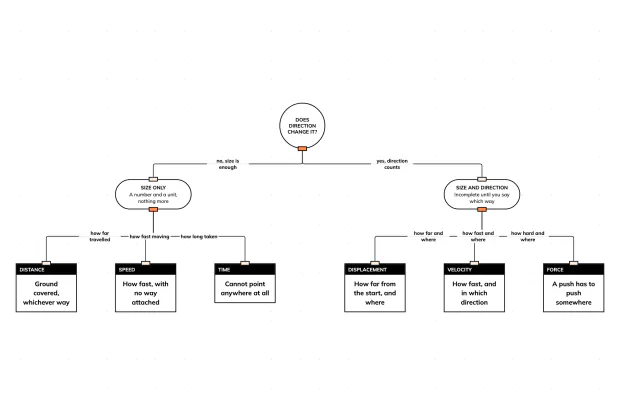
Why Direction Makes It Velocity, Not Just Speed
Run a full lap and your average velocity is zero, however hard you ran. Find out why direction changes the quantity itself, and sort six of them in an interactive playground.
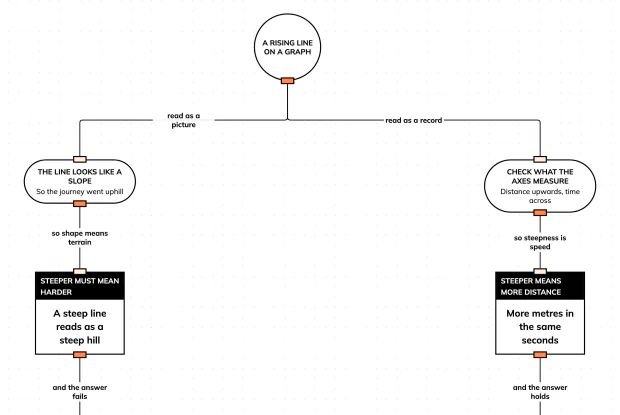
Why a Distance-Time Graph Is Not a Picture
A rising line does not mean a hill and a flat line does not mean level ground. Find out what a distance-time graph actually records, and read one properly in an interactive playground.
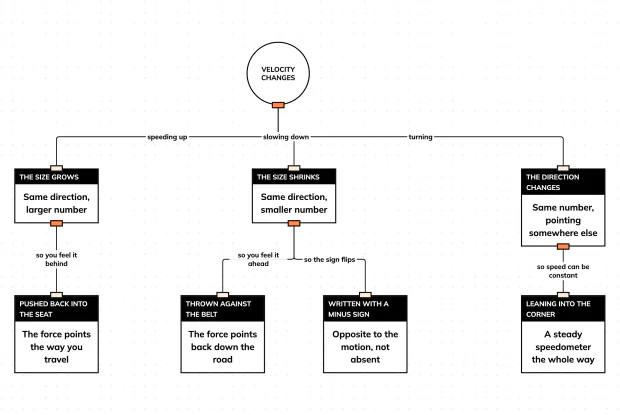
Why Slowing Down Is Also Acceleration
Braking is acceleration. So is turning a corner at a steady speed. Find out why acceleration means change rather than fastness, and build the three cases in an interactive playground.
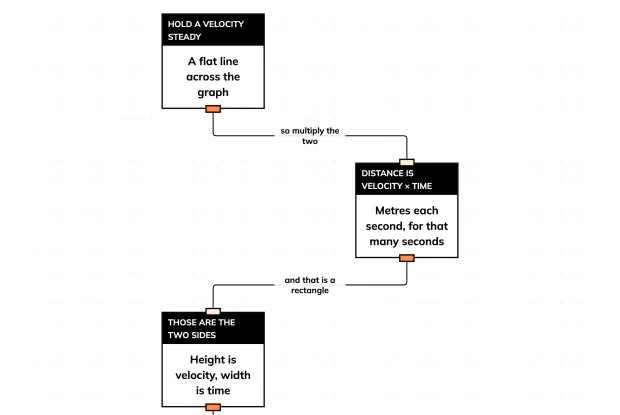
Why Area on a Velocity-Time Graph Is Distance
On a velocity-time graph the steepness is acceleration and the area underneath is distance travelled. Follow why that is true rather than a rule to memorise, in an interactive playground.