Why a Distance-Time Graph Is Not a Picture
Root Concept
A distance-time graph plots how far something has travelled against how long it has been travelling, so the steepness of the line is the speed and a horizontal line means stopped — none of which is visible if the graph is read as a drawing of the route, which is the mistake almost everyone makes first.
CodePLU Goal
Upgrading Human Mental Models
Learn how to think in Workflows

Concept Development By codeplu.com
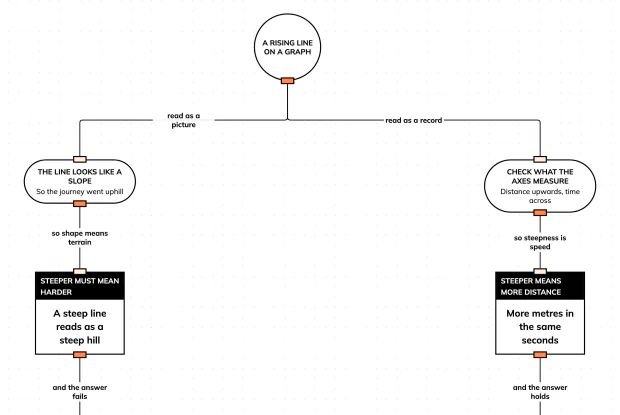
Both routes start from the same line on the same graph. The left one never checks the axes, and every conclusion after that is about scenery the graph does not contain.
The Graph That Looks Like a Hill
Show someone a distance-time graph with a line climbing steeply and then levelling off, and ask what happened. A great many people will say the journey went up a hill and then reached the top. It is a completely reasonable thing to say. The line goes up and then flattens, and that is what a hill looks like.
It is also wrong in every particular. The graph says nothing whatever about hills, because neither axis measures height. The steep part means the thing was moving quickly, and the flat part means it had **stopped** — not that it reached level ground, but that it stopped moving altogether and stayed exactly where it was.
This mistake is so common that it has a name in education research: students read the graph as an iconic picture of the motion rather than as a record of it. And it is not a sign of carelessness. Graphs really do look like pictures, we spend our lives reading pictures, and nothing on the page announces that this one has to be read differently.
What makes it a record rather than a picture is the horizontal axis. It is not space. It is time, and time only ever moves forward at the same rate, so the line can never come back on itself or go up vertically. Once you have noticed that, the whole graph reads differently and the readings become reliable.
Reading It as a Record
What is actually plotted on each axis?
Time runs along the bottom and distance travelled runs up the side, and that pairing is the whole of it. Every point on the line is a statement of the form "after this long, I had gone this far". A point at four seconds and twelve metres means exactly that and nothing else — it says nothing about which way the object was facing, what the ground was like, or where it was on a map. **Neither axis measures height, so nothing on the graph can represent a hill.** It is worth saying out loud the first few times, because the eye keeps offering the picture reading back. The line is a history, and reading it means asking what had happened by each moment rather than what the route looked like.
Why does steepness mean speed?
Because steepness compares how much distance was gained with how much time it took, and that division is the definition of speed. A steep section climbs a lot of metres while moving only a little way along the time axis, which is a lot of distance in little time — fast. A shallow section creeps up a few metres across a wide stretch of time — slow. The maths category calls this the gradient of a line and shows how to measure it; physics supplies what the gradient means here, and the meaning is speed. Two lines can therefore be compared at a glance without working anything out, because whichever is steeper belongs to whatever was moving faster.
What does a horizontal line mean?
That the object stopped. This is the reading people find hardest to accept, because a flat line looks so much like flat ground or like steady progress. Think about what the line is saying instead: time keeps advancing, since it always does, while the distance figure does not change at all. Minutes are passing and not one extra metre has been covered. That is standing still. A steady walk is not a horizontal line but a straight sloping one, which trips people up precisely because "steady" and "flat" feel like they ought to match. **Flat means stopped; straight means steady.** The two readings are a line apart on the page and completely different in what they describe.
Why can the line never go backwards or straight up?
Because of what the axes are. Going backwards along the graph would mean time running in reverse, and nothing does that, so every line moves left to right without exception. A perfectly vertical line would mean covering distance while no time passed at all, which is infinite speed. Neither shape can appear, and knowing that is a free check on your own reading: if your interpretation requires one, you have misread something. A line that turns downwards is allowed on some graphs and means returning towards the start, which is why the vertical axis has to say whether it is measuring total distance or displacement from the starting point. Checking the label on that axis before reading anything else takes a second and settles which shapes are even possible.
Real World Example
Three Readings Worth Practising
Each of these is a shape that appears constantly in exam questions, and each has a picture reading that feels right and is not.
Step 1
The bus that waits at every stop
A bus route plotted this way looks like a staircase: sloping sections where the bus drives, separated by flat treads where it sits at a stop with passengers boarding. The picture reading sees steps up a hillside. The record reading sees moving, stopped, moving, stopped — and can count the stops by counting the flat sections, and say which leg was quickest by comparing how steep the slopes are, all without knowing a single thing about the road. The staircase shape is created entirely by the waiting, which is the one thing a picture reading cannot see.
Step 2
Two runners on the same axes
Draw two runners on one graph and the comparison becomes visual. The steeper line is the faster runner, always, whatever else the lines do. Where they cross, both runners have gone the same distance at the same moment — which means they are level with each other, not that they collided. Before the crossing one was ahead and after it the other was, so a single intersection tells the whole story of an overtake, including the moment it happened. None of that requires a calculation, which is exactly why the graph is drawn in the first place.
Step 3
A curve, which the picture reading cannot handle
A line that bends upwards gets steeper as it goes, and steeper means faster, so the object is speeding up. A line that bends the other way is flattening out, so it is slowing down and may be coming to rest where the curve goes horizontal. The picture reading has nothing useful to say about either, since both look like vague landscape. The record reading handles them with the same single rule it used on the straight lines, and gets a changing speed out of a changing steepness. One rule covering every shape is a good sign that the rule is the right one.
FAQs
Final Words
A distance-time graph is a record of when something was where, and reading it as a drawing of the route is the mistake nearly everyone makes first. The eye offers the picture because the line genuinely looks like scenery, and the axes are the only thing that says otherwise — time across the bottom, distance up the side, and neither of them height.
Once that is settled the readings follow from one rule. Steepness is speed, so steeper is faster and a straight line is a steady pace. Horizontal means stopped rather than level. The line cannot go backwards, because time does not.
That rule works because distance is being compared against time. The next tutorial puts velocity on the vertical axis instead, which changes what the graph means and turns slowing down into a kind of acceleration.
Continue This Track
This concept is part 3 of Putting Numbers on Motion.
What Does Average Speed Hide? Two Kinds of Speed
A car averages 50 km/h and never once drives at 50. Find out why that is normal rather than contradictory, and sort the two kinds of speed in an interactive playground.
Why Direction Makes It Velocity, Not Just Speed
Run a full lap and your average velocity is zero, however hard you ran. Find out why direction changes the quantity itself, and sort six of them in an interactive playground.
Why a Distance-Time Graph Is Not a Picture
A rising line does not mean a hill and a flat line does not mean level ground. Find out what a distance-time graph actually records, and read one properly in an interactive playground.
Why Slowing Down Is Also Acceleration
Braking is acceleration. So is turning a corner at a steady speed. Find out why acceleration means change rather than fastness, and build the three cases in an interactive playground.
Why Area on a Velocity-Time Graph Is Distance
On a velocity-time graph the steepness is acceleration and the area underneath is distance travelled. Follow why that is true rather than a rule to memorise, in an interactive playground.