How Do You Predict What the Offspring Get?
Root Concept
A Punnett square predicts the offspring of a cross by listing the gametes each parent can produce, combining every possible pairing in a grid, and counting the resulting genotypes, which gives the expected proportions as probabilities rather than guaranteed numbers.
CodePLU Goal
Upgrading Human Mental Models
Learn how to think in Workflows

Concept Development By codeplu.com
Every step is bookkeeping except the last one, and the last one is where the mistakes happen.
A Grid for Counting Possibilities
Two tutorials have established what an individual carries and why one version can hide another. The obvious next question is what happens when two individuals have offspring, and it turns out to be answerable with nothing more than careful counting.
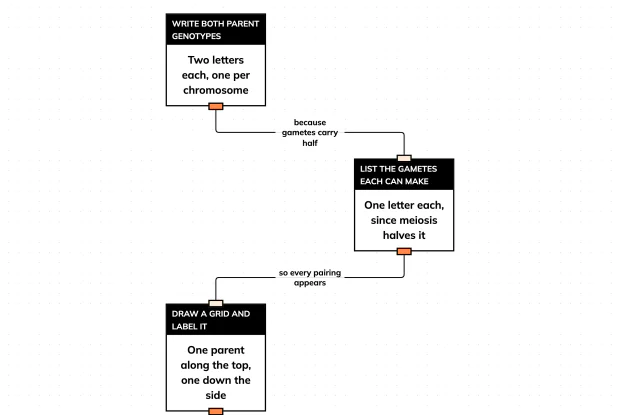
Everything needed is already in place. Each parent carries two alleles of the gene. Each gamete gets one of them, chosen at random, because meiosis halves the chromosome number — that was the whole argument of the previous track. Fertilisation combines one gamete from each parent. So the offspring's genotype is one allele taken at random from each parent, and the question becomes simply: what are all the ways that can happen, and how many of each are there?
A Punnett square is the bookkeeping device for answering that. One parent's possible gametes go along the top, the other's down the side, and each square in the grid holds the combination that results when those two meet. Every square is equally likely, because every gamete is equally likely, so counting the squares gives the proportions directly.
The method is genuinely easy. What is not easy, and what the last step in the playground is there to flag, is reading the answer correctly. A three-to-one ratio does not mean that four children will come out three and one. It means each child independently has a three-in-four chance, which is a different claim and leads to different expectations.
Working Through the Steps
Why list the gametes rather than the parents?
Because the grid combines gametes, not parents, and getting this step wrong is the commonest error in the whole method. A parent with two different alleles — write them B and b — can make two kinds of gamete, one carrying B and one carrying b, in equal numbers, because meiosis separates the pair and sends one to each side. A parent with two identical alleles can make only one kind, however many gametes it produces. So the number of columns and rows is set by how many kinds of gamete each parent can make, not by how many alleles it carries. A homozygous parent gets one row; a heterozygous parent gets two.
Why is every square equally likely?
Because each kind of gamete is produced in equal numbers and fertilisation does not favour any of them. A heterozygous parent makes half its gametes carrying one allele and half carrying the other, since the pair separated at random during meiosis. Which gamete happens to take part in a fertilisation is a matter of chance. So each combination in the grid is as probable as any other, which is what allows the proportions to be read off by counting squares. If the squares were not equally likely the counting would be meaningless, so this assumption is doing real work and is worth noticing rather than passing over. It is also an assumption that can fail: some alleles do affect how well a gamete survives, and then the ratios come out skewed.
Why count genotypes and phenotypes separately?
Because they give different ratios and the question usually asks for the second. Cross two heterozygous parents and the four squares give one homozygous dominant, two heterozygous and one homozygous recessive — a genotype ratio of one to two to one. But three of those four show the dominant characteristic, because one working copy is enough, so the phenotype ratio is three to one. The famous three-to-one is a phenotype ratio, and it already has the previous tutorial's reasoning folded into it. Reporting a genotype ratio when a phenotype ratio was asked for is a standard way to lose marks and, more importantly, to misunderstand what the cross actually showed. Work out the genotype ratio first and then translate it, rather than trying to go straight to phenotypes.
Why is the answer a probability?
Because fertilisation is a chance event and a grid of possibilities is not a schedule. A three-to-one ratio means each offspring independently has a three-in-four chance of showing the dominant characteristic. Four offspring may come out four and none; that is not evidence against the prediction any more than four heads in a row disprove a fair coin. The ratios become reliable only over large numbers, which is why genetics was worked out on pea plants producing hundreds of seeds rather than on animals producing a handful of offspring. This is also why the same calculation about a particular family can never say what will happen, only what the odds are.
Real World Example
Mendel and Twenty-Nine Thousand Pea Plants
The method is named after Reginald Punnett, but the ratios it predicts were found by Gregor Mendel decades earlier, and the reason he found them is as instructive as the result.
Step 1
He chose characteristics with two clear states
Mendel worked on pea plants in a monastery garden in the 1850s and picked seven characteristics that each came in two obvious forms: tall or short, round or wrinkled seeds, green or yellow pods. There was nothing intermediate to argue about, so every plant could be counted into one category or the other without judgement. Most inherited characteristics are not like this — height in humans varies continuously — and choosing the ones that are was a large part of why the work succeeded where earlier attempts had failed. Choosing what to measure is often the hardest part of an experiment.
Step 2
He counted tens of thousands of plants
Over about eight years Mendel grew and recorded something like twenty-nine thousand pea plants. That scale is the point, not an incidental detail. A three-to-one ratio does not appear in four plants, or reliably in forty; it emerges from hundreds and is solid in thousands. Anyone repeating the experiment with a dozen plants would see a jumble and conclude nothing at all. The ratios are statistical facts about large numbers, and they were invisible until somebody was patient enough to produce large numbers. Eight years of growing, crossing and counting peas is what the ratios actually cost.
Step 3
The explanation was ignored for thirty-five years
Mendel published in 1866 and the work was almost entirely overlooked, partly because it was arithmetic in a field that was then descriptive, and partly because nobody yet knew about chromosomes — there was no physical thing for his units of inheritance to be. The work was rediscovered around 1900, by which time chromosomes had been seen under microscopes and the behaviour of pairs separating in meiosis matched his arithmetic exactly. The prediction came first and the mechanism caught up with it thirty-five years later, which is an unusual order for a scientific idea and a large part of why the story is still told.
FAQs
Final Words
Six steps and five of them are bookkeeping. Write down what each parent carries; work out what gametes each can make, remembering that a gamete carries one allele because meiosis halved it; draw the grid; fill each square with the pair that would meet there; count. Every square is equally likely, so counting gives proportions directly — and counting genotypes and counting phenotypes give different answers, which is why the famous three-to-one already has dominance folded into it.
The sixth step is the one that goes wrong. A ratio is a probability for each offspring independently, not a quota that a family will fill. Mendel needed twenty-nine thousand plants precisely because ratios are invisible in small numbers, and the same arithmetic applied to one family can only ever give odds. The next tutorial takes a word from this method that gets misread even more often than the ratios do.
Continue This Track
This concept is part 3 of Why You Look Like Your Parents.
What Is an Allele? Two Copies, Possibly Different
You carry two copies of every gene, one from each parent, at the same place on a matching pair of chromosomes. Label the pair in an interactive playground and the word allele stops being abstract.
Why Can a Gene Be Carried Without Showing?
Dominant and recessive are usually just defined. Reason instead from what a gene does — build a protein — to why one version hides the other, in an interactive playground.
How Do You Predict What the Offspring Get?
Given what two parents carry, a Punnett square predicts what their offspring can be and in what proportions. Follow the six steps in order in an interactive playground, and see why the answer is a probability.
Dominant Does Not Mean Common — Two Questions
Dominant describes what shows in one individual. Common describes how many individuals carry it. Follow both questions from the same allele in an interactive playground and see why neither answer predicts the other.
Is It the Genes or the Surroundings? Sort It Out
Some differences are written in the genes, some come entirely from how someone lived, and most are both. Sort four of them in an interactive playground and see why running in a family proves nothing.