How Do You Read a Rate Graph? Steepness Is Rate
Root Concept
On a graph of product against time the steepness of the curve is the rate, so a reaction is fastest at the start and slows as its reactants are used up, and the height the curve levels off at is the total amount produced — which means a faster reaction reaches the same total sooner rather than producing more of it.
CodePLU Goal
Upgrading Human Mental Models
Learn how to think in Workflows

Concept Development By codeplu.com
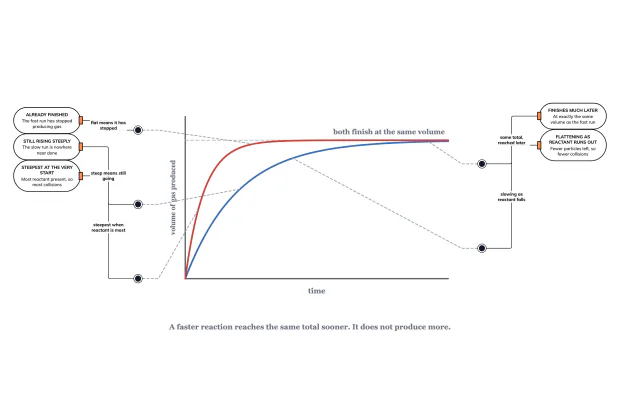
Both curves level off at the same height. The faster one got there sooner; it did not get further.
Two Questions One Curve Answers
A rate experiment usually produces a gas, and the easiest thing to measure is how much of it has appeared by a given moment. Plot that against time and you get a curve that answers two separate questions at once — which is exactly why it gets misread.
The first question is how fast. That is the steepness: a steep part of the curve means a lot of gas is appearing each second, and a flat part means almost none is. Because steepness changes along the curve, so does the rate, and reading a single number off a rate graph is usually the wrong move.
The second question is how much. That is the height: where the curve levels off is the total amount produced, and it stops rising because a reactant has run out. Nothing after that point is about speed at all.
Keeping the two apart is the whole skill, and the figure is built to force it. Both curves are the same reaction, one run faster than the other. The fast one is dramatically steeper and finishes much sooner — and it levels off at exactly the same height. A faster reaction reaches the same total sooner; it does not produce more. Reading a steeper curve as a bigger yield is the commonest error in this topic.
Reading the Shape
Why is every curve steepest at the start?
Because that is when the most reactant is present, and the previous tutorials explain the rest. A rate is a count of successful collisions per second, and collisions happen between particles that are still there. At the start of a reaction every reactant particle is available, so collisions are at their most frequent and the curve rises fastest. As the reaction proceeds those particles are consumed, encounters become rarer, and the rate falls — which is the curve bending over. No reaction has a constant rate for long, and a straight line on this kind of graph would be the surprising thing rather than the normal one. The bend is the reaction reporting its own progress.
What does the flat part mean?
That the reaction has finished, not that it has slowed to a crawl. The curve stops rising because something has run out — one of the reactants is entirely used up, and no amount of further waiting produces anything. Whichever reactant runs out first is the one that decides the total, and the other is left over in the flask. That is why two runs of the same reaction with the same quantities always level off at the same height however differently they got there: the amount of product is fixed by how much reactant you put in, and the conditions only decide how long it takes to arrive. Which reactant runs out first is worth identifying before an experiment rather than after, since it is the one that sets the ceiling.
How do you compare two runs properly?
Compare the steepness, not the endpoint. If one curve is steeper at every point than another, that run was faster throughout — and the conditions that made it so are the levers from the previous tutorial. If both level off at the same height, the same amount of reactant was used in both and only the speed differed. If they level off at different heights, something about the quantities changed, not just the conditions, and that is a different experiment. Reading the two features separately turns a pair of curves into a diagnosis: this one was faster, and this one had more to work with. Two numbers from one picture, provided you do not read either as the other.
How is a rate actually got off the graph?
As a gradient — an amount divided by a time. Over a whole interval, the average rate is the change in volume divided by the time it took, so a reaction producing 60 cm³ of gas in 30 seconds has averaged 2 cm³ per second. At a single moment the rate is the steepness of the curve at that point, found by drawing a tangent and taking its gradient. The units are the giveaway that a rate is always a per-something: cubic centimetres per second, grams per minute, moles per second. A rate with no time in its units is not a rate. That check catches a surprising number of wrong answers before any arithmetic is done.
Real World Example
What a Curve Tells You That a Single Number Cannot
The shape carries information that a stopwatch reading of "it took four minutes" throws away entirely.
Step 1
Marble chips and acid, lumps against powder
A standard school experiment drops calcium carbonate into dilute acid and measures the carbon dioxide released, which is the carbonate reaction from the acids track. Run once with lumps and once with the same mass as powder, and the two curves look exactly like the figure: the powder rises far more steeply and flattens early, the lumps take much longer, and both end at the same height. Same mass of carbonate, same amount of gas, different speeds — which is the entire point drawn in two lines. The experiment is run under supervision with eye protection, and the gas is collected rather than allowed to escape.
Step 2
A curve that levels off lower means something ran short
If a repeat of the same experiment flattens at a lower height, the conditions are not what changed. Less reactant was present, or one of them ran out sooner than intended — perhaps the acid was more dilute and was entirely consumed while carbonate remained. That is a quantity problem rather than a rate problem, and treating it as a rate result would be a straightforward misreading. The height and the steepness are answering different questions and a careless glance merges them. Checking the plateau before the gradient is a good habit, because it tells you whether the two runs are comparable at all.
Step 3
Industrial reactions are run on the steep part
A chemical plant generally does not wait for a reaction to level off, because the last few per cent of a conversion take disproportionately long — the curve is almost flat by then and the equipment is tied up producing very little. It is often cheaper to stop early, separate the product, and recycle the unreacted material back to the start. The decision is read straight off a curve like this one: the flat part is where time stops buying you much. The chemistry sets the shape of the curve and the economics decides where on it to stop.
FAQs
Final Words
A rate curve answers two questions and they are easy to merge. The steepness is the rate, so a reaction is fastest at the very start — when the most reactant is present and collisions are most frequent — and slows as those particles are consumed, which is the curve bending over. The height it levels off at is the total, and it stops rising because a reactant has run out entirely rather than because things have got slow.
Both curves in the playground are the same reaction with the same quantities, run at different speeds, and they level off at exactly the same height. That is the thing worth taking away: a faster reaction reaches the same total sooner, and does not produce more. If two runs end at different heights, the quantities changed and not just the conditions. The next tutorial takes the one lever that speeds a reaction up without being used up at all.
Continue This Track
This concept is part 3 of How Fast Does a Reaction Go.
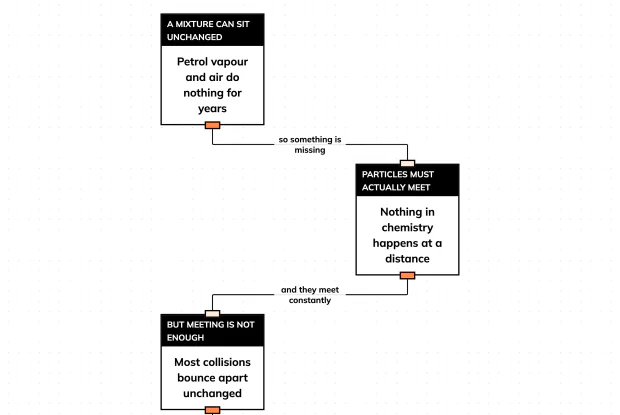
What Has to Happen for a Reaction to Occur?
Petrol vapour and air sit together for years without reacting, then go off in milliseconds. Work out what was missing, and what a reaction rate counts, in an interactive playground.
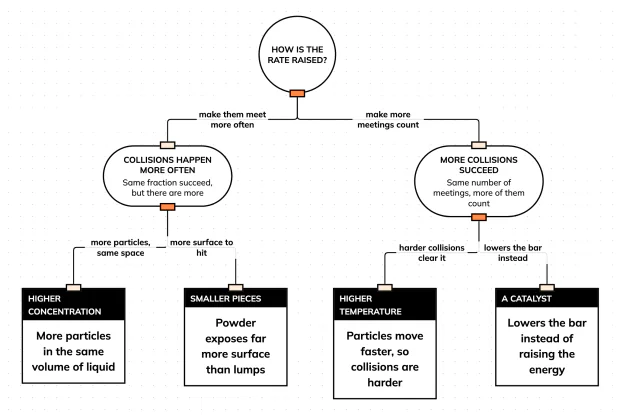
What Makes a Reaction Go Faster? Only Two Things
Temperature, concentration, surface area and catalysts look like four unrelated tricks. They are two, and knowing which is which tells you what each one will do. Sort them in an interactive playground.
How Do You Read a Rate Graph? Steepness Is Rate
Two curves, one reaction, two speeds. The steepness tells you the rate and the final height tells you the amount — and they are different things. Label both curves in an interactive playground.
What Does a Catalyst Actually Do? It Lowers the Bar
A catalyst speeds a reaction up without being used up and without adding any energy. Work out how that is possible, in an interactive playground.
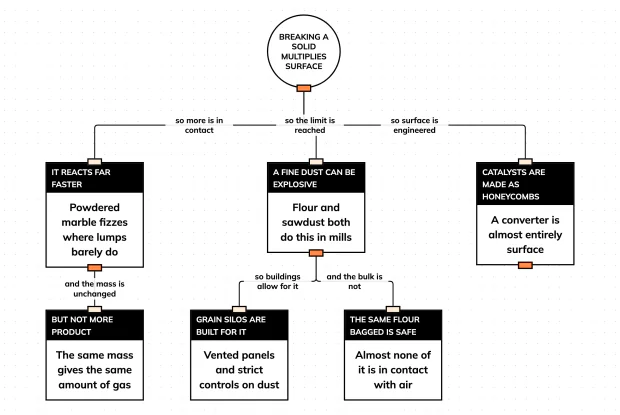
Why Does a Powder React So Much Faster Than a Block?
A lump of flour burns slowly and a cloud of it explodes. Same substance, same mass, and the only difference is how much of it the air can reach. Trace the consequences in an interactive playground.