What Makes a Graph a Straight Line?
Root Concept
A constant rate of change draws a straight line, so the steepness is the rate and the straightness is the fact that the rate never varies.
CodePLU Goal
Upgrading Human Mental Models
Learn how to think in Workflows

Concept Development By codeplu.com
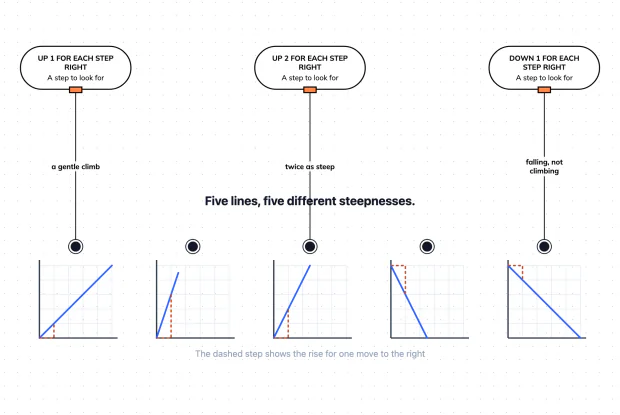
The same step every time — match each description to its line
What Has to Be True for a Graph to Be Straight?
Take y = 2x and walk along it. From x = 0 to x = 1, y goes from 0 to 2, a rise of two. From 1 to 2, y goes from 2 to 4, a rise of two again. From 2 to 3, another two. The step is the same every time, and that is exactly what makes the graph straight.
A line bends when its steps change size. If each move right raised y by two, then three, then five, the plotted points would curve upward rather than lining up. So straightness is not a property of the drawing; it is a statement about the situation, and the statement is that the rate never changes.
That constant step has a name, the gradient or slope, and it is the number multiplying x in the equation. In y = 2x the step is two. In y = x it is one, a gentler climb. And a negative number means the line falls as you move right, which is a perfectly ordinary line describing something that decreases. In the playground below you match three descriptions of a step to the lines they produce.
Why Is the Line Straight?
How do you measure the steepness of a line?
Move one step to the right and see how far the line rises. That rise is the gradient. If moving one across takes you two up, the gradient is two, and this is the number multiplying x in the equation, which is why y = 2x climbs twice as fast as y = x. If it is easier to measure over a bigger jump, you can: go four across, see how far it rises, and divide by four. The answer is the same wherever on the line you measure, and that is not a coincidence — it is the definition of the line being straight. On a curve you would get a different answer in different places.
What does a downward line mean?
That the quantity falls as x increases, and the gradient is negative. A line with gradient negative one drops one square for each step right, so its equation has a minus in front of the x. There is nothing unusual about it; plenty of real situations decrease, such as the fuel left in a tank as a journey goes on, or money left in an account as the month passes. Beginners sometimes treat a falling line as a mistake or a special case. It is neither. The only thing that changes is the sign of the number, and the method for reading and drawing it is exactly the same.
What does a gradient of zero look like?
A flat line. If each step right raises y by nothing at all, the line never climbs, and the equation is just y equals some number — y = 3 draws a horizontal line three units up, everywhere. It is worth meeting because it makes the pattern complete: positive gradients climb, negative ones fall, and zero stays level. Something that stays constant whatever x does is genuinely common, such as a fixed monthly charge that does not depend on usage, and drawing it as a flat line rather than treating it as no line at all keeps it comparable with everything else on the same axes.
Real World Example
What Does Steepness Mean Off the Page?
Gradient is a rate, so wherever something changes at a steady pace there is a straight line waiting to be drawn:
A tank filling up
up 20 litres each minute
A tap fills a tank at twenty litres a minute. Plot minutes along the bottom and litres up the side and you get a straight line climbing twenty for each step right, so the gradient is twenty. It is straight because the tap does not speed up or slow down; the rate is the same in the tenth minute as in the first. If somebody half-closed the tap partway through, the line would bend at that moment and carry on at a shallower angle, and the bend would be visible long before anybody worked out any numbers.
A tank draining
down 5 litres each minute
A second tank leaks five litres a minute. Its line falls rather than climbs, dropping five squares for each step right, so the gradient is negative five. The steepness still means the rate, and the sign tells you which direction the quantity is going. Drawn on the same axes as the filling tank, the two lines cross at the moment both tanks hold the same amount of water, and reading that crossing point off the graph answers a question that would otherwise take an equation with the unknown on both sides. The picture and the algebra are answering the same question in two ways.
A car at a steady speed
60 km for each hour
Plot distance against time for a car holding sixty kilometres an hour and the line climbs sixty for each hour across. Gradient is speed here, which is the clearest example of why a gradient is a rate rather than just an angle. Stop at a junction and the line goes flat for a moment: gradient zero, because distance is not changing while time still is. Speed up afterwards and it climbs more steeply. The whole journey can be read from the shape without a single number, which is what makes this kind of graph worth drawing.
FAQs
Final Words
A graph is straight when the rise for each step right is always the same, and that constant step is the gradient — the number multiplying x in the equation. A bigger number climbs more steeply, a negative one falls, and zero stays flat.
Because gradient is a rate, it usually means something concrete: litres a minute, kilometres an hour, rupees a call. That completes the grid, and with it the whole of Algebra as far as this chapter goes — from a first letter standing for a number to a line holding every answer at once.
Continue This Track
This concept is part 4 of Algebra on a Grid.
What Are Coordinates and How Do You Plot a Point?
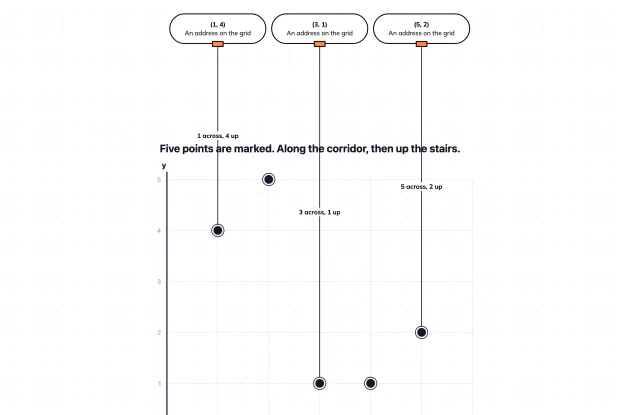
A pair of coordinates is an address on a grid, and the order is the whole of it. Learn how to read and plot a point in an interactive playground.
How Do You Read a Value Off a Graph?
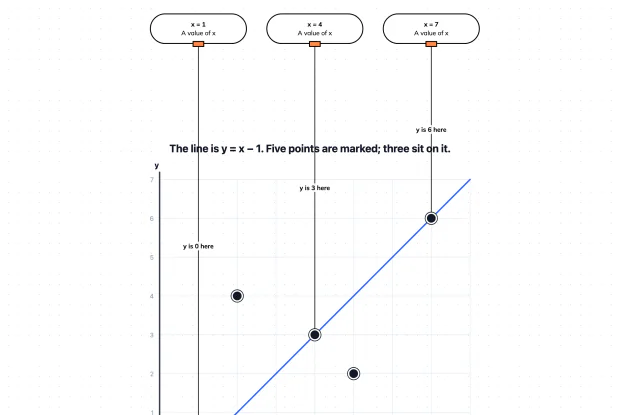
A graph answers questions you never calculated, if you can read it. Learn how to go from an x value to its y value, and find three of them in a playground.
What Does the Graph of an Equation Look Like?
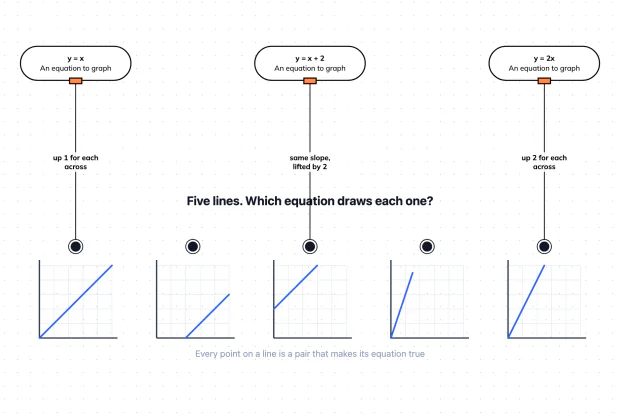
A graph is not a picture of an equation — it is every solution of it, plotted at once. Learn what the line means and match three equations in a playground.
What Makes a Graph a Straight Line?
A graph is straight when the rise per step never changes. Learn what steepness means, what a downward line says, and match three steps in a playground.