What Does the Graph of an Equation Look Like?
Root Concept
The graph of an equation is the set of all its solutions plotted as points, which is why the line is a picture of an answer rather than of a rule.
CodePLU Goal
Upgrading Human Mental Models
Learn how to think in Workflows

Concept Development By codeplu.com
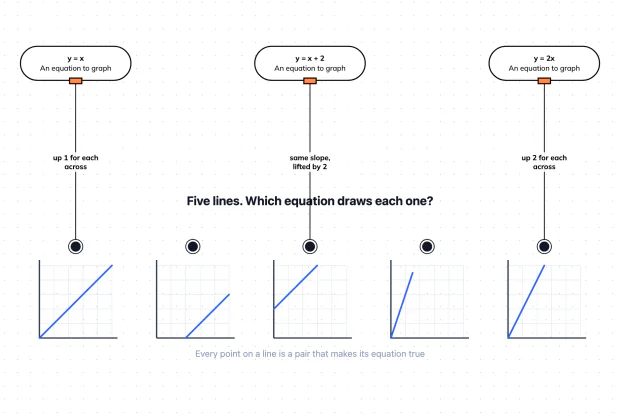
Where it crosses and how steeply it climbs — match each equation to its line
Why Does an Equation Turn Into a Line?
Take y = x + 2 and start feeding numbers in. When x is 0, y is 2. When x is 1, y is 3. When x is 2, y is 4. Each of those is a pair, and a pair is an address on a grid: (0, 2), (1, 3), (2, 4). Plot them and they fall in a row. Keep going, filling in the values between, and the row fills out into a line.
So the line is not a drawing of the equation the way a photograph is a drawing of a face. It is the complete set of pairs that make the equation true, all marked at once. Every point on it works, and every point off it does not, which is a much stronger statement than it sounds.
Two features of the line carry the two numbers in the equation. Where it crosses the y-axis is the number added on the end, and how steeply it climbs is the number multiplying x. In y = x + 2 the line crosses at 2 and climbs one for each step across. In the playground below you match three equations to their lines, with decoys that differ by exactly one of those two features.
What Does the Line Mean?
How do you draw the line from the equation?
Pick two or three values of x, work out the y that goes with each, plot the pairs and join them. For y = 2x, taking x as 0, 1 and 2 gives the points (0, 0), (1, 2) and (2, 4), and a ruler through them is the graph. Two points are strictly enough to fix a straight line, but always plot a third, because two points can be joined however wrongly you calculated them and nothing will look amiss. A third point that fails to line up tells you immediately that one of the three is wrong, which is a check worth the extra ten seconds every single time.
What does the crossing point on the y-axis mean?
It is the value of y when x is zero, which is exactly the number sitting on its own in the equation. In y = x + 2, setting x to zero leaves y as 2, so the line passes through (0, 2). In y = 2x there is no number added on, so setting x to zero gives y as zero and the line goes through the origin. That is why every equation of the form y equals something times x, with nothing added, draws a line through the corner of the grid — and it is the quickest way to tell two otherwise similar lines apart at a glance.
What does it mean that a point is not on the line?
That the pair does not satisfy the equation, and the line is making that claim about every point on the whole grid at once. Take y = x + 2. The point (1, 3) is on the line because one plus two is three. The point (1, 4) is not, because one plus two is not four, and sure enough it sits one square above. This is the part beginners often miss: the line is not just a helpful summary of a few calculations, it is a complete answer. Anything on it works, anything off it fails, and there is nothing in between.
Real World Example
What Does a Real Line Actually Tell You?
The two things that describe a line both mean something concrete when the line describes a real situation:
The rule
cost = 2m + 30
A phone plan charges a fixed thirty rupees a month plus two rupees for every minute of calls. Written as a rule that is cost = 2m + 30, where m is the minutes used. Drawn as a graph with minutes along the bottom and cost up the side, it becomes a straight line, and the line holds every possible bill for every possible amount of calling. Nothing in the picture was not already in the rule, but the picture makes two things visible that the rule states without emphasis, and both of them are what a customer actually cares about.
Where it starts
30 rupees, before any call
The line crosses the cost axis at thirty, because that is what you pay when m is zero. Somebody who makes no calls at all still owes thirty rupees, and on the graph that is simply where the line begins rather than a special case to remember. Comparing two plans on the same axes makes it immediate: the one starting higher up the axis has the bigger standing charge, and you can see that without reading a single number off. The number added on the end of the equation is where the line starts, and on a bill it is the part you cannot avoid paying.
How fast it climbs
2 rupees for each minute
For each step right along the minutes axis, the line rises two rupees. That steepness is the rate, and it is the number multiplying m in the equation. A plan with a cheaper per-minute rate draws a shallower line, and the point where two lines cross is the amount of calling at which the two plans cost the same — which is the same crossover question solved earlier with an equation, now visible as a place on the page. The steepness is the rate, the crossing point is the fixed charge, and between them they describe the whole plan.
FAQs
Final Words
The graph of an equation is every pair of numbers that makes it true, plotted at once. Anything on the line works and anything off it does not, which makes the line a complete answer rather than an illustration.
Two features carry the equation's two numbers: where the line crosses the y-axis is the number added on the end, and how steeply it climbs is the number multiplying x. That steepness is worth its own look, and it is what makes the line straight in the first place.
Continue This Track
This concept is part 3 of Algebra on a Grid.
What Are Coordinates and How Do You Plot a Point?
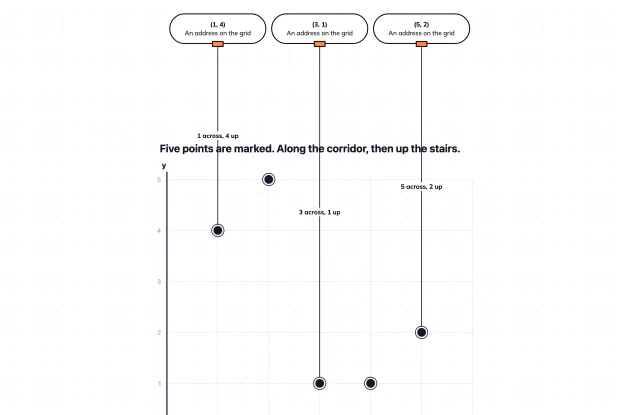
A pair of coordinates is an address on a grid, and the order is the whole of it. Learn how to read and plot a point in an interactive playground.
How Do You Read a Value Off a Graph?
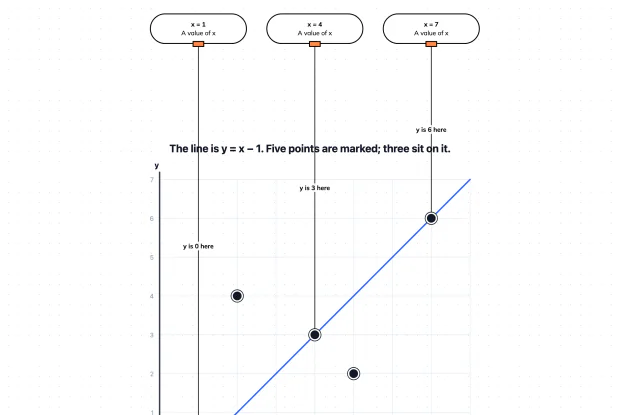
A graph answers questions you never calculated, if you can read it. Learn how to go from an x value to its y value, and find three of them in a playground.
What Does the Graph of an Equation Look Like?
A graph is not a picture of an equation — it is every solution of it, plotted at once. Learn what the line means and match three equations in a playground.
What Makes a Graph a Straight Line?
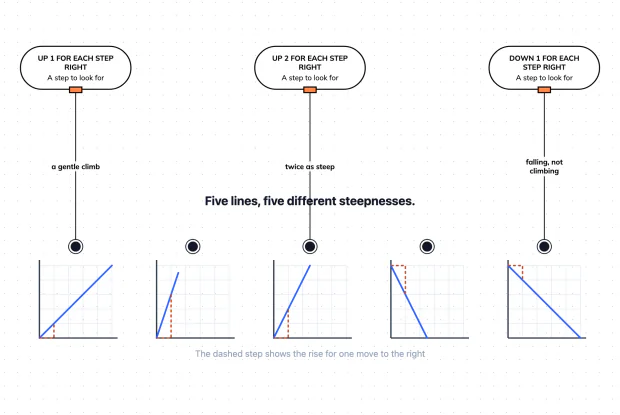
A graph is straight when the rise per step never changes. Learn what steepness means, what a downward line says, and match three steps in a playground.