How Do You Read a Value Off a Graph?
Root Concept
A line is a record of every answer at once, so reading one off is a matter of finding the right place on it rather than calculating anything.
CodePLU Goal
Upgrading Human Mental Models
Learn how to think in Workflows

Concept Development By codeplu.com
Up to the line, then across — and check the point is really on it
What Is a Line Actually Storing?
A drawn line is not decoration. Every point on it is a coordinate pair, and every one of those pairs is an answer to the same question asked with a different number. A line across a grid is therefore a whole table of results at once, written in a form you can read in a second rather than calculate.
Reading one off takes two moves. Find your x value on the horizontal axis and go straight up until you hit the line. Then turn and go straight across to the vertical axis, and read the number you land on. That is the y value that goes with your x. Up to the line, then across to the answer.
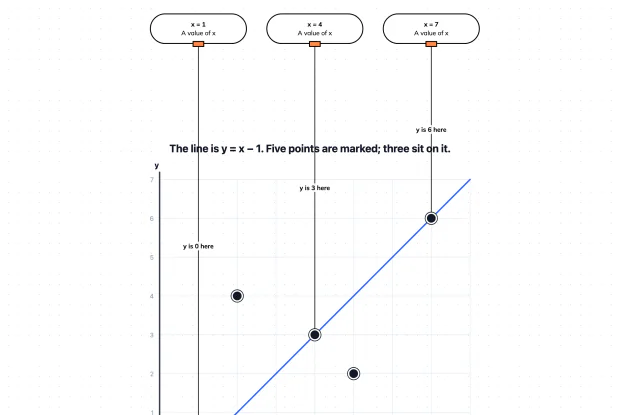
Two things go wrong often enough to be worth naming in advance. Going across before going up answers a different question entirely, and taking a reading from a point that only looks close to the line gives an answer that is quietly wrong. In the playground below, five points are marked and only three of them are genuinely on the line.
How Do You Get an Answer From a Line?
What is the order of the two moves?
Up from the x-axis first, then across to the y-axis. You start with a value of x, so you start on the x-axis, and the line is what tells you where to stop climbing. Turning across at that height gives the matching y. Doing it the other way round — starting on the y-axis and reading back — is a perfectly good procedure, but it answers the opposite question: given a y, what was the x? Both are useful and they are not interchangeable, so decide which one you are being asked for before you start drawing. It helps to sketch the two arrows faintly on the graph itself, because then the answer you read off cannot be the wrong one.
How do you know a point is really on the line?
Test it against the equation, if you have one. The line in the playground below is y = x − 1, so the point (4, 3) belongs to it because four minus one is three. The point (5, 2) does not, because five minus one is four rather than two — and on the grid it sits clearly below the line, once you look. By eye alone a point can be a whole square away and still look plausible at a glance, especially near the middle of a graph where there is nothing to compare it against. When accuracy matters, the equation settles it in a couple of seconds and your eye does not.
What does reading between the gridlines give you?
An estimate, and a perfectly respectable one. If your x value falls halfway between two gridlines, the height you reach on the line falls between two values too, and you read the closest sensible number. That is not a failure of the method; reading approximate values off a graph is one of the main reasons graphs are drawn in the first place. It is worth saying out loud which kind of answer you are giving, though. An exact value comes from substituting into the equation, and a read-off value comes from the picture. Both are useful, and confusing one for the other is how a rough reading ends up being quoted as a precise result.
Real World Example
When Is Reading a Graph Faster Than Working It Out?
Graphs earn their place when the same conversion has to be done over and over by people in a hurry:
The problem with a formula
rupees = 104 × pounds
A currency desk converts pounds to rupees at a hundred and four rupees to the pound. As a formula that is complete and exact, and for a large or unusual amount it is what you would use. But a queue of customers wants rough figures quickly — what is forty pounds, what is sixty-five — and multiplying by a hundred and four in your head for each of them is slow and error-prone. The formula is right and it is the wrong tool for this particular job, which is the situation graphs exist for. What the queue needs is a lookup, not a calculation.
The same rule as a line
one line, every amount at once
Draw pounds along the bottom and rupees up the side, mark a couple of known conversions, and join them with a straight line. That single line now holds every conversion in the range simultaneously. Nothing has been calculated that was not already in the formula; the results have simply been worked out in advance and stored in a shape the eye can search. This is what a graph is for, and it is why the line being straight matters so much — two known points were enough to draw the whole thing, and every value between them came along for free.
Reading one off
40 pounds, straight up then across
A customer asks about forty pounds. Find forty along the bottom, run a finger up until it meets the line, then across to the rupee axis, and read about four thousand one hundred and sixty. It takes a second and needs no arithmetic at all. If the finger goes across first instead of up, the answer coming back is what forty rupees is worth in pounds, which is a completely different and much smaller number — the same reversal error as writing a coordinate pair backwards, and just as easy to make in a hurry.
FAQs
Final Words
A line is every answer to one question, stored at once. To read one off, go up from your x value until you meet the line, then across to the y-axis. Going across first is a different question with a different answer, so decide which you want before you start.
Check a point against the equation when it matters, because the eye is easily fooled by a point that sits near the line rather than on it. Next, where the line itself comes from: what an equation looks like once it is drawn.
Continue This Track
This concept is part 2 of Algebra on a Grid.
What Are Coordinates and How Do You Plot a Point?
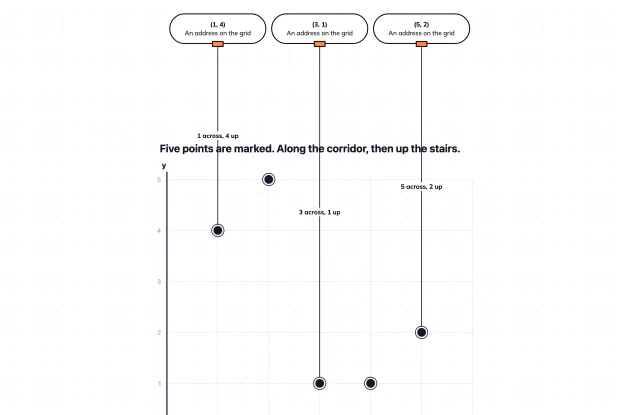
A pair of coordinates is an address on a grid, and the order is the whole of it. Learn how to read and plot a point in an interactive playground.
How Do You Read a Value Off a Graph?
A graph answers questions you never calculated, if you can read it. Learn how to go from an x value to its y value, and find three of them in a playground.
What Does the Graph of an Equation Look Like?
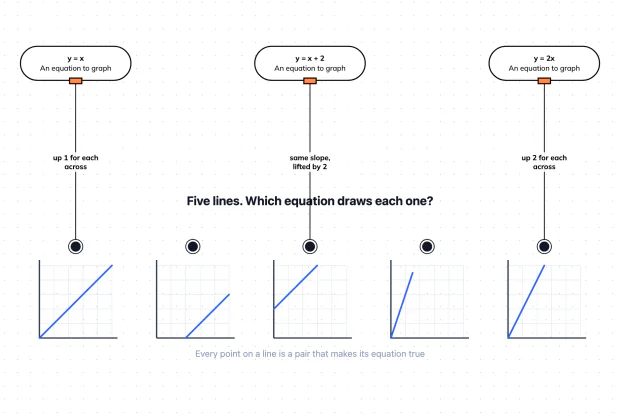
A graph is not a picture of an equation — it is every solution of it, plotted at once. Learn what the line means and match three equations in a playground.
What Makes a Graph a Straight Line?
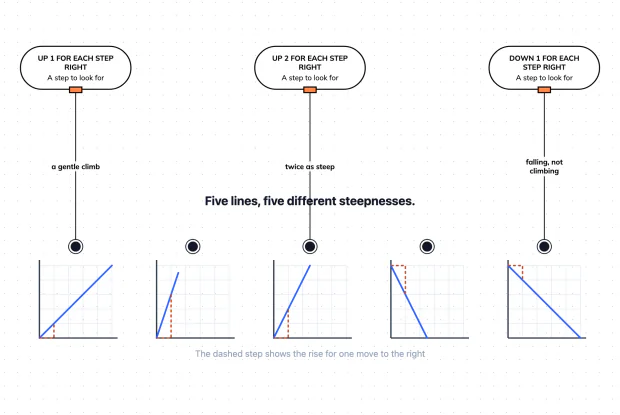
A graph is straight when the rise per step never changes. Learn what steepness means, what a downward line says, and match three steps in a playground.