How Do You Clean Messy Data Before Analysing It?
Root Concept
Every real dataset arrives broken in predictable ways — duplicates, blanks, mismatched formats, and impossible values — and each one skews your answer in its own direction until you fix it.
CodePLU Goal
Upgrading Human Mental Models
Learn how to think in Workflows

Concept Development By codeplu.com
Four common messes in real data, and the specific damage each one does to your answer
Why Does Real Data Always Need Cleaning?
Imagine inheriting a shoebox of a shop's receipts. Some are duplicated because the till printed twice. Some have the total smudged away. Dates are written every which way — 3/4, April 3rd, 03-04. And one receipt claims a customer bought nine hundred loaves of bread. Before you can say anything about this shop, that box has to be sorted out.
Every real dataset is that shoebox. Data is created by people in a hurry and systems that break quietly, so it arrives inconsistent, incomplete, and occasionally impossible. This is not a sign that something went unusually wrong — it is the normal condition of real data, and practitioners consistently report that finding and fixing it eats more of their time than the analysis itself.
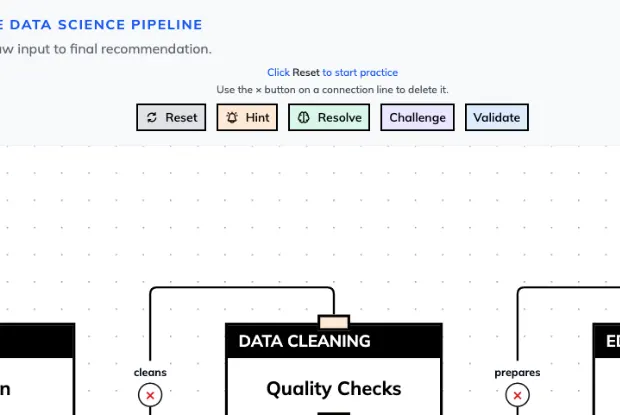
The good news is that the mess comes in recognisable types. Once you can spot duplicates, blanks, mismatched labels, and impossible values, you know most of what you will meet. And crucially, each one damages your answer in its own specific way — which is what you will build out in the playground above.
What Are the Common Messes, and What Do They Do?
Why are duplicate rows so dangerous?
Duplicates arrive constantly: an import runs twice, a form is submitted again after a slow page, one customer appears under two accounts. They are dangerous because they do not look like errors. Every duplicated row is a perfectly valid record, so nothing flags it and every total quietly grows — sales look higher, customer counts look bigger, and a busy Tuesday can appear to be your best day ever. Finding them means deciding what makes a row unique in the first place, which is a judgement, not a button. Two orders from the same customer at the same second are almost certainly one order; two orders a week apart are two customers being loyal.
What should you do about blank cells?
Gaps are the most common mess of all, and the naive fix is the worst one: quietly dropping every row with a blank. Do that and you have not removed a problem, you have changed who is in your data. If a third of customers left their age blank, and the ones who did were mostly older, dropping them makes your findings describe young customers only — a blind spot nothing warns you about. The honest approach is to ask why the gap exists. Sometimes blank means zero, sometimes it means 'not asked', sometimes it means the system broke that week. You may fill the gaps with a sensible substitute, drop the column, or report the finding with the limitation stated — but only after you know what the emptiness means.
Why do mismatched labels split your data?
Humans typing into boxes produce 'UK', 'U.K.', 'United Kingdom', and 'uk ' with a trailing space. To a computer these are four unrelated categories, so your largest market fragments into several small ones and vanishes from the top of your chart. The same happens with 'Female'/'F', product names in different capitalisations, and dates stored in mixed formats where 03/04 might be March or April. The fix is standardising each column to one form, and the reason it matters beyond neatness is that this mess makes real things invisible — you can look straight at your biggest customer segment and not see it.
How do you handle values that cannot be real?
Every dataset contains a few impossible entries: an age of 214, a negative price, a delivery that arrived before it was ordered, a temperature of minus nine hundred. Usually these are placeholders someone chose to mean 'unknown', or a broken sensor, or a typo. They matter enormously to averages, because a single absurd number can drag an average far from the truth while the median barely moves. So decide the plausible range for each column before you look, investigate anything outside it, and record what you did. Be careful, though: an unusual value is not automatically an error. Genuinely exceptional customers exist, and deleting them because they are inconvenient is how you end up analysing a world that does not exist.
How do you know when the data is clean enough?
There is no perfectly clean dataset, so the target is not perfection — it is data good enough to answer your specific question. If you are counting orders, duplicate rows are critical and a missing age column is irrelevant. If you are comparing age groups, the reverse is true. So work backwards from the question and fix what could change your conclusion. Two habits make this professional rather than hopeful: never edit your original file, and write down every change you make. When someone asks in three months why your number differs from theirs, that record is the difference between a clear answer and an awkward shrug.
Real World Example
How Did Dirty Data Nearly Close the Wrong Shop?
A small retail chain wants to know which of its three branches performs worst, so it can act. Everything hinges on cleaning, and the first answer is wrong.
The first answer looks clear and is wrong
Straight from the raw export, the riverside branch has by far the lowest recorded sales, and the numbers look decisive enough to act on. The regional manager begins drafting a plan to close it.
Duplicates were flattering two branches
A closer look shows the till system at the two larger branches uploaded its data twice for six weeks after an update. Their totals were inflated by thousands of duplicated rows, while riverside — on older equipment — reported honestly.
Mismatched labels were hiding sales entirely
Riverside's staff had typed the branch name inconsistently: 'Riverside', 'River side', and 'RIVERSIDE'. Two of those spellings were being counted as unrelated branches and dropped from the comparison, so a real chunk of its sales was invisible.
One impossible value distorted the averages
A single transaction recorded at ninety thousand pounds — a decimal point typo on a nine-pound sale — had pushed one branch's average basket size up so far that it looked like it attracted premium customers. Nobody had questioned it.
The cleaned answer reversed the decision
With duplicates removed, spellings standardised, and the typo corrected, riverside was performing in the middle of the pack, and a different branch was the genuine laggard. The cleaning took two days. Closing the wrong shop would have cost a great deal more.
FAQs
Final Words
Real data arrives broken in four familiar ways: rows repeated, cells left empty, the same thing spelled differently, and values that cannot possibly be true. In the playground you connected each mess to the specific damage it does — inflated counts, silent blind spots, split groups, and distorted averages.
Two professional habits matter more than any technique. Never touch the original file, and write down every change you make. And keep the purpose in view: the goal is not spotless data but data good enough to answer your question honestly — which is exactly what stops a clean-looking number from closing the wrong shop.
Continue This Track
This concept is part 4 of Data Science From the Ground Up.
What Is Data Science?
Data science is not just charts and not just coding. Learn what it really is by seeing how it differs from the two jobs sitting either side of it — and why it always ends in a decision.
What Are the Types of Data?
Some data arrives in tidy rows, some arrives with labels but no table, and some arrives as photos and voice notes. Learn to tell the three types apart and what each one costs you to use.

What Are the Steps of the Data Analysis Workflow?
Most beginners start with data and hope a chart shows something. Professionals start with a question. Walk the five steps of a real analysis, from the question to the answer someone acts on.
How Do You Clean Messy Data Before Analysing It?
Real data arrives broken: duplicates, blanks, mismatched formats, and impossible values. Learn what each mess does to your answer and the fix that clears it.